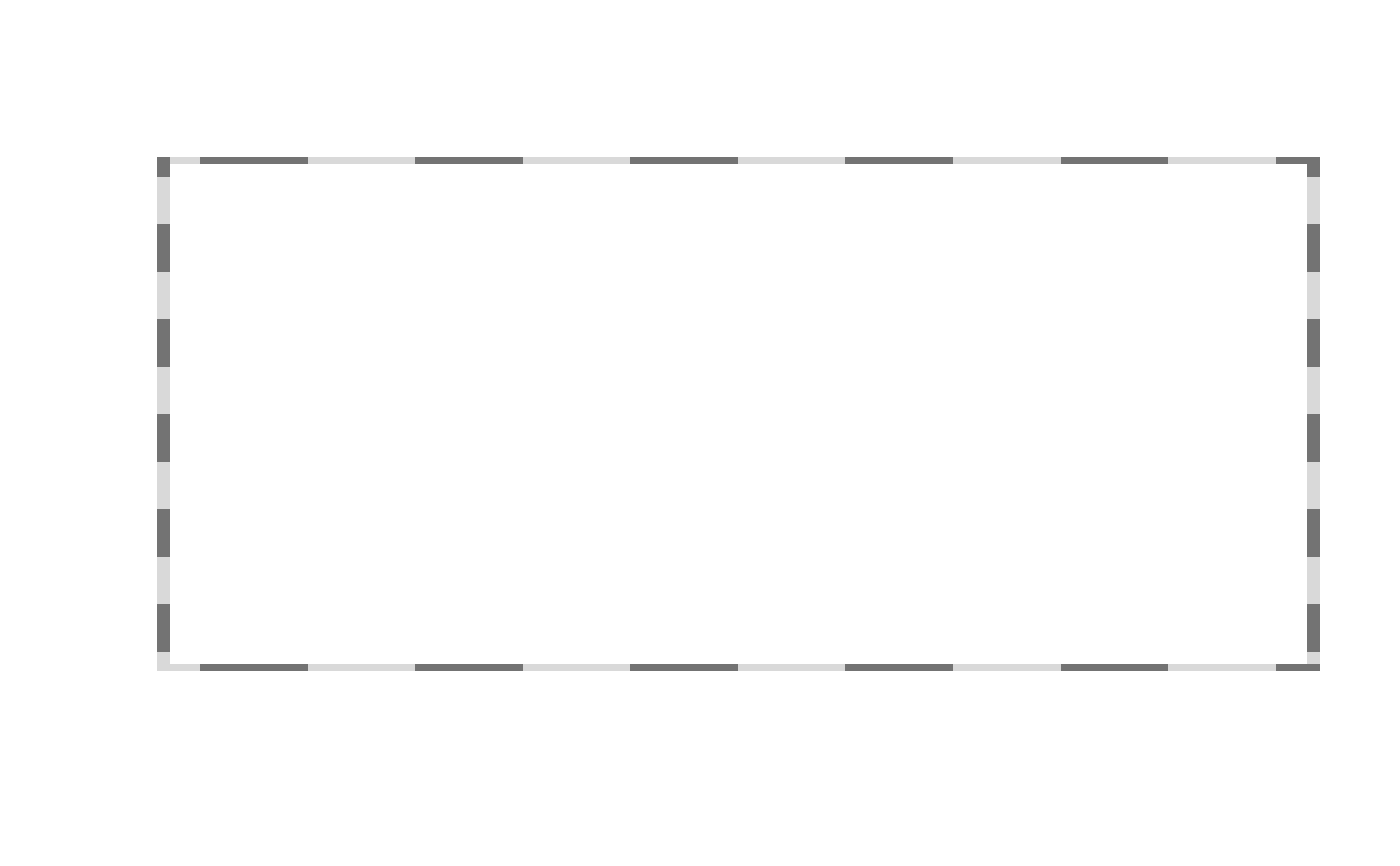
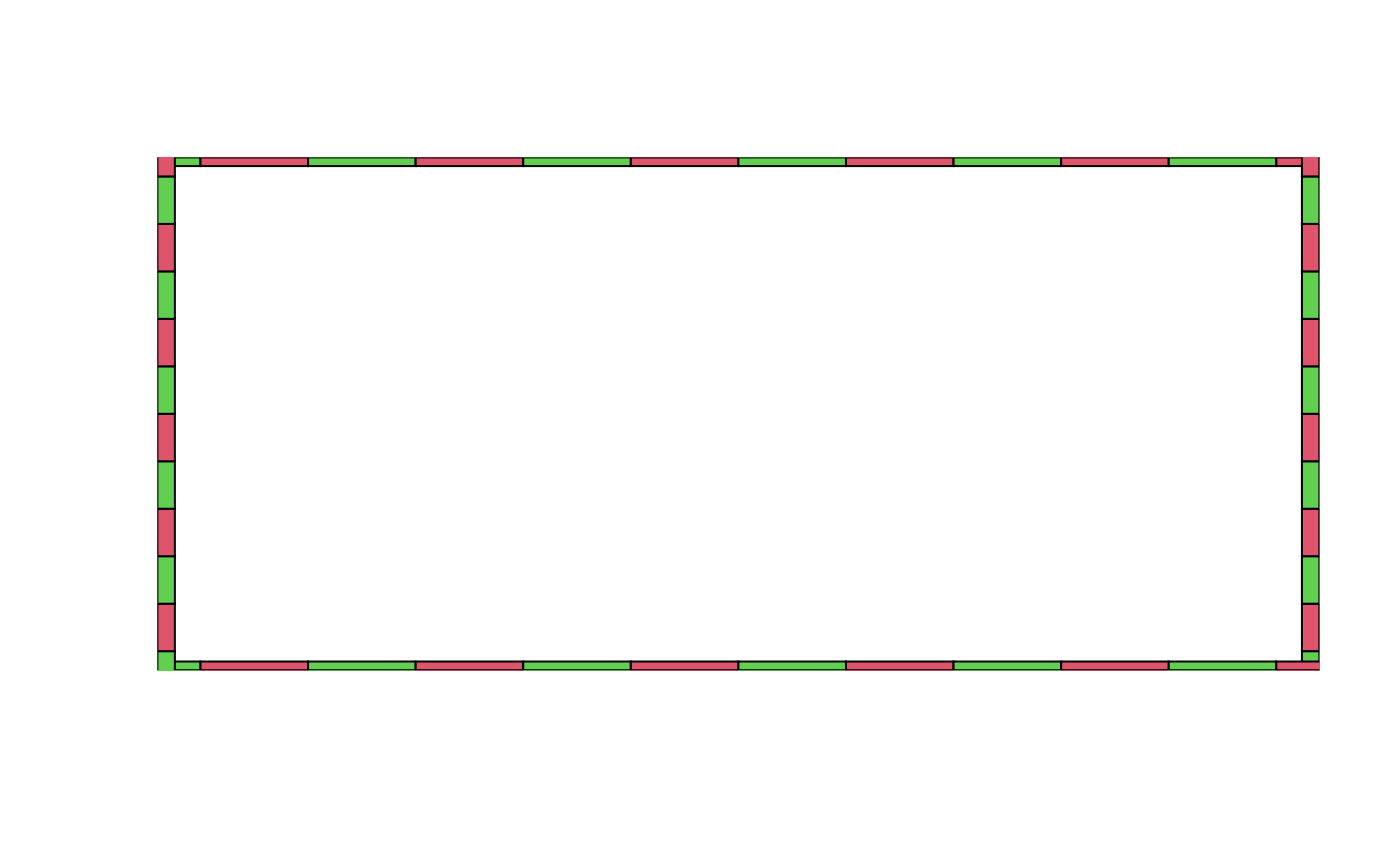
Draw a frame around the plot region as an ensemble of small rectangles whose colors can be specified.
frameIt(
  nbc = 10,
  cex.x = 1,
  cex.y = cex.x,
  col = c("grey45", "grey85"),
  border = NA
)
Arguments
| nbc | number of rectangles to be drawn for each axis. |
|---|---|
| cex.x | control the dimension |
| cex.y | The radii of the circles. |
| col | color of the rectangles drawn. |
| border | color of the borders if the rectangles drawn. |
Details
The number of rectangles could be different from nbc as pretty is called
to properly locate them. The col argument determines the succession of
colors to be applied to each axis.
Examples
frameIt()

