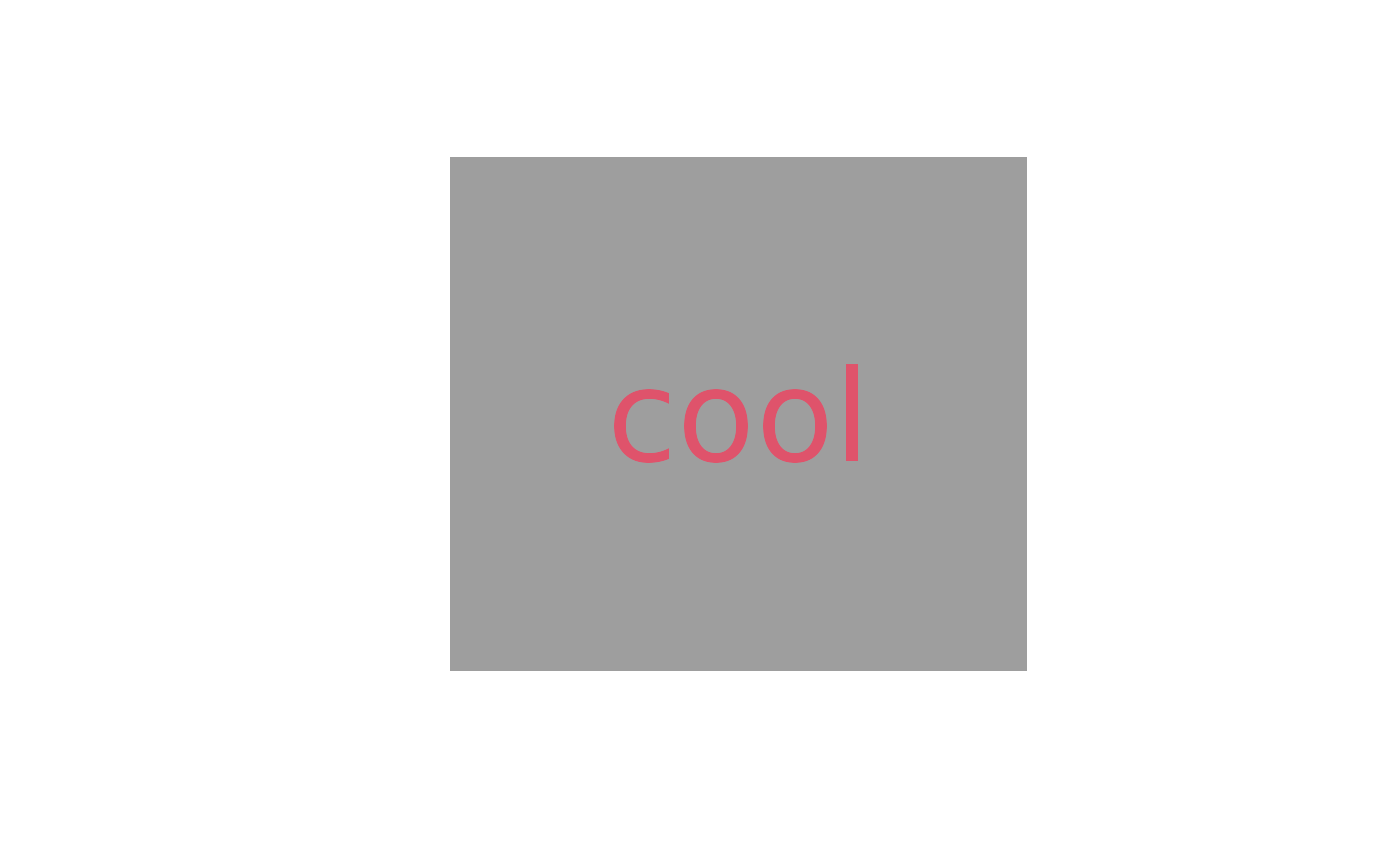
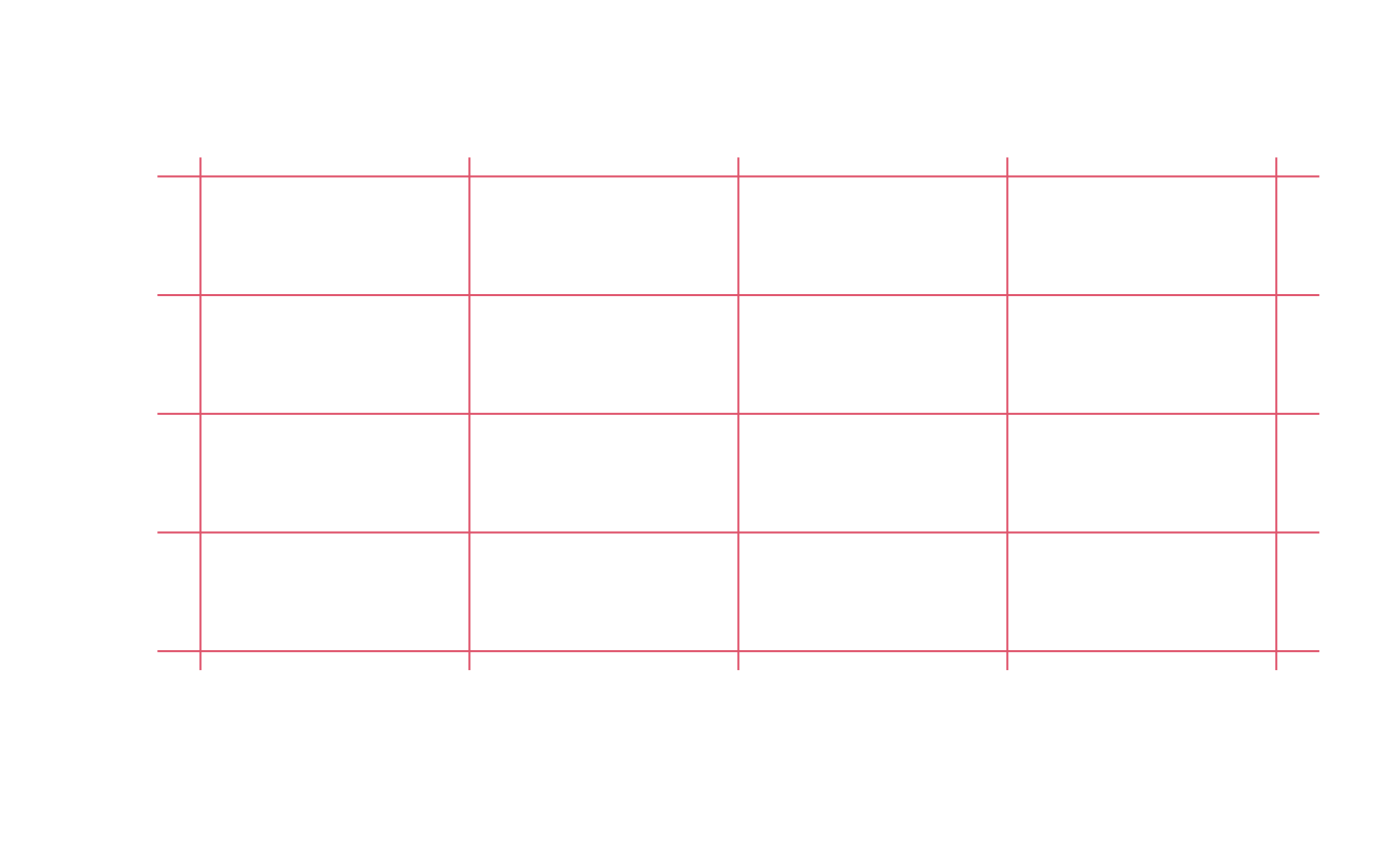
plot0 returns an a plot of a specific size without any symbols.
plot0(
  x = c(-1, 1),
  y = NULL,
  fill = NULL,
  text = NULL,
  grid.col = NULL,
  grid.lwd = 1,
  grid.lty = 1,
  ...
)
Arguments
| x | the x coordinates of points in the plot or a matrix of coordinates. |
|---|---|
| y | the y coordinates of points in the plot. |
| fill | The color to be used to fill the plot area. |
| text | A character string or a object to be coerced as character string that will be displayed in the center of the plot region. |
| grid.col | color of the grid's lines. The default value is |
| grid.lwd | line width of the grid's lines. |
| grid.lty | line type of the grid's lines. |
| ... | further graphical parameters from |
Examples
# Example 1 plot0()