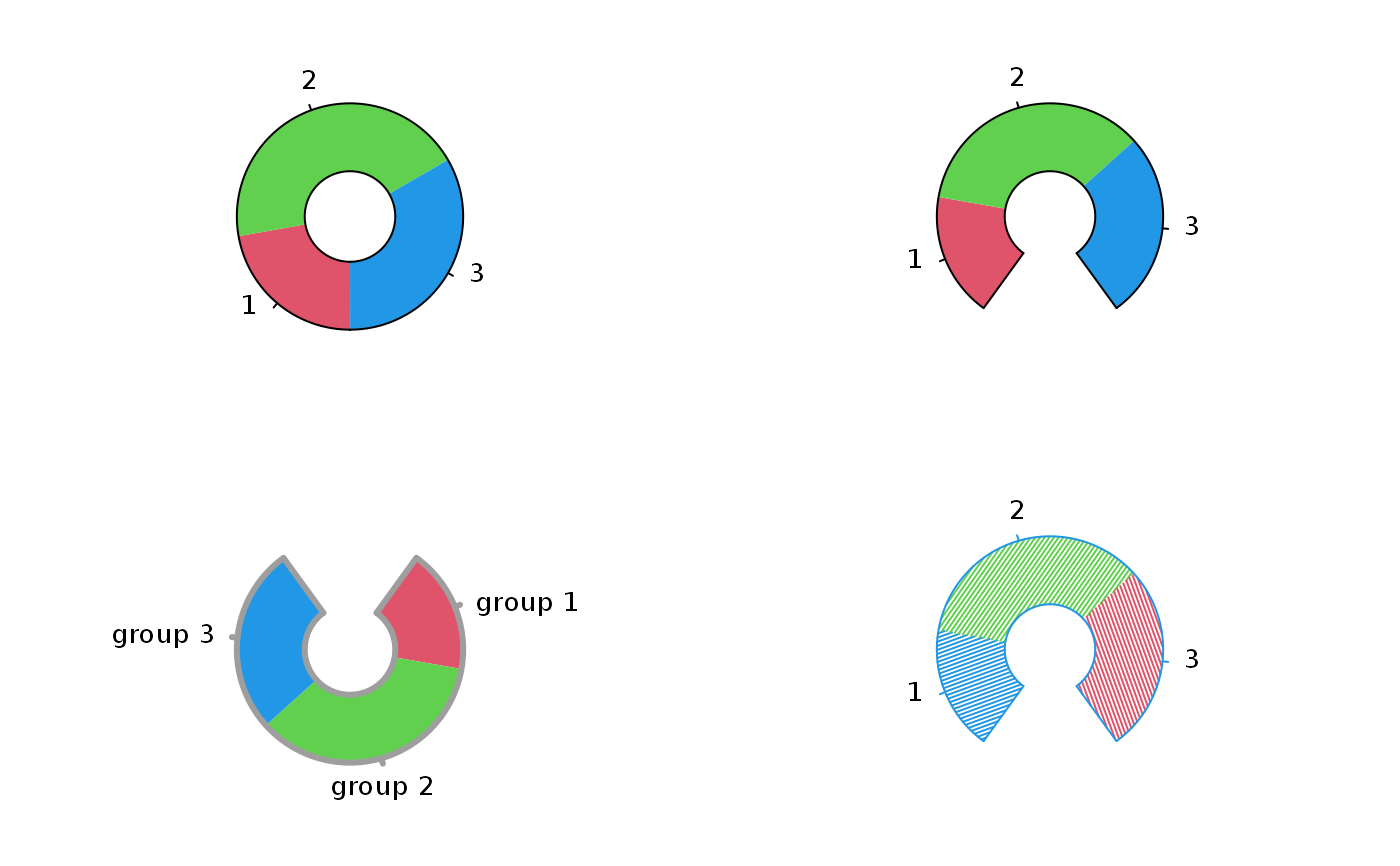
Draw a donut chart.
donut(
  vec,
  eaten = 0,
  labels = NULL,
  rot = 0,
  cex = 0.8,
  tck = 0.05,
  width = 0.6,
  mycol = 1 + seq_along(vec),
  density = NULL,
  angle = 45,
  dt = 0.001,
  add = FALSE,
  cx = 0,
  cy = 0,
  border = NA,
  clockwise = TRUE,
  ...
)
Arguments
| vec | a vector of non-negative numerical quantities that are displayed as the areas of donut slices. |
|---|---|
| eaten | the eaten part. |
| labels | one or more expressions or character strings giving names for the slices. |
| rot | the rotation angle (in degree). |
| cex | the magnification coefficient to be used for the size of the donut. |
| tck | the magnification coefficient to be used for the length of the tick marks. |
| width | the width of the donut (set between 0 and 1). |
| mycol | vector of colors to be used. |
| density | the density of shading lines, in lines per inch. The default value of |
| angle | the slope of shading lines, given as an angle in degrees (counter-clockwise). |
| dt | point density of the drawn circles. |
| add | a logical. Should the donut chart be added on the current graph? If |
| cx | the magnification coefficient to be used for the total horizontal width of the donut. |
| cy | controls the total vertical width of the donut. |
| border | the border color of the donut, set to |
| clockwise | a logical. Shall slices be drawn clockwise? |
| ... | additional arguments to be passed to lines methods. |
Details
As pie chart, donut charts are a very bad way of displaying information, see graphics::pie()
The aspect of the donut is fully customizable. If width is set to 1 and eaten to 0, the donut chart is then a pie chart.
Note
Substantial part of the code have been inspired by the pie function.
The 'col' argument determines the succession of colors to be applied to each axis.
Examples
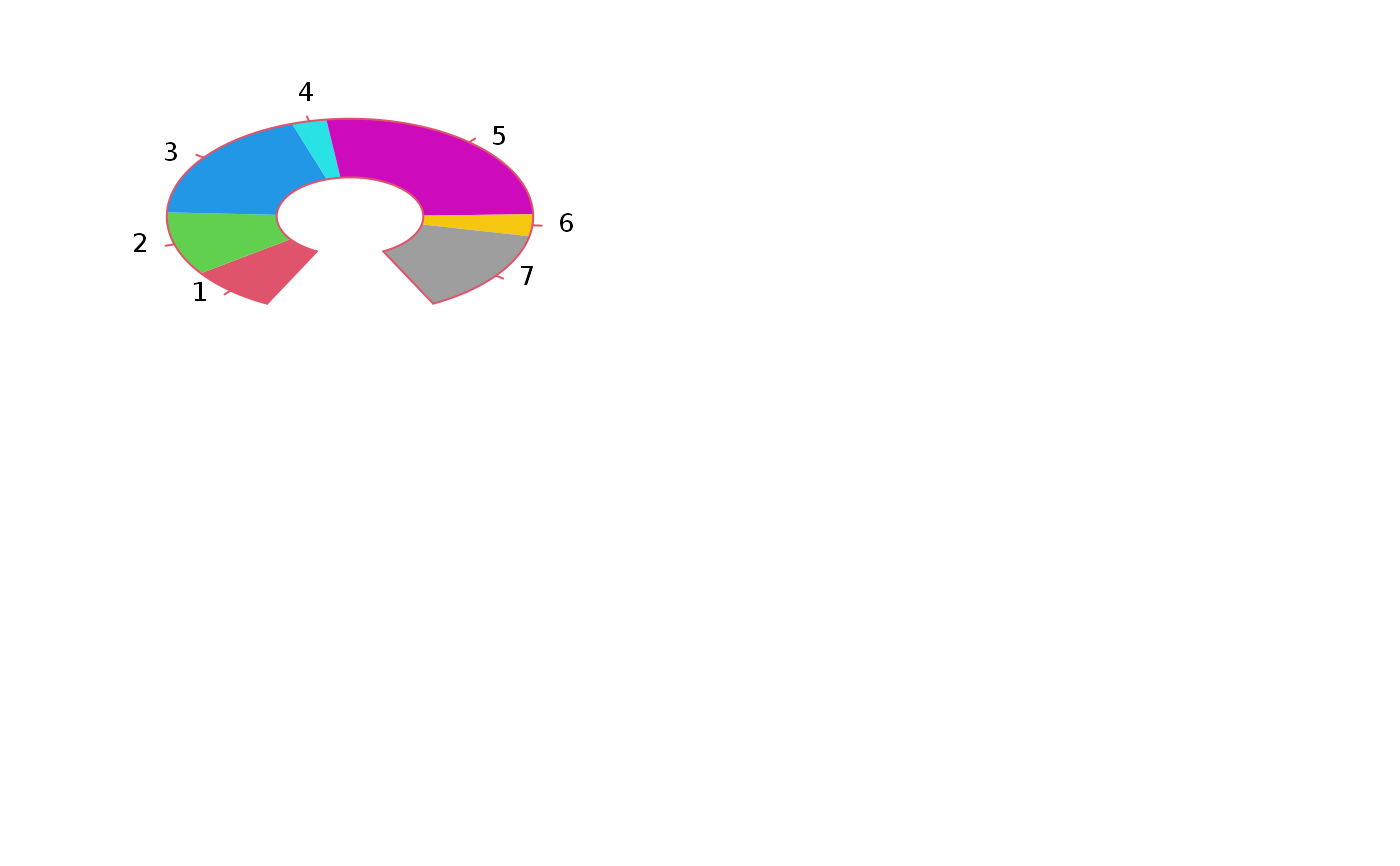
#Example 1: graphics::par(mfrow=c(2,2), mar=rep(2,4)) donut(vec=c(10,20,15)) donut(c(10,20,15), eaten=0.2) donut(c(10,20,15), eaten=0.2, rot=180, labels=paste('group',1:3), lwd=3, col=8) donut(c(10,20,15), 0.2, cx=4, col=4, mycol=c(4,3,2), density=30, angle=c(20,55,110))#Example 2: plot0(c(0,10),c(0,40), type='n') vec <- runif(7) donut(vec, 0.15, cx=5, cy=20, add=TRUE, col=2)

