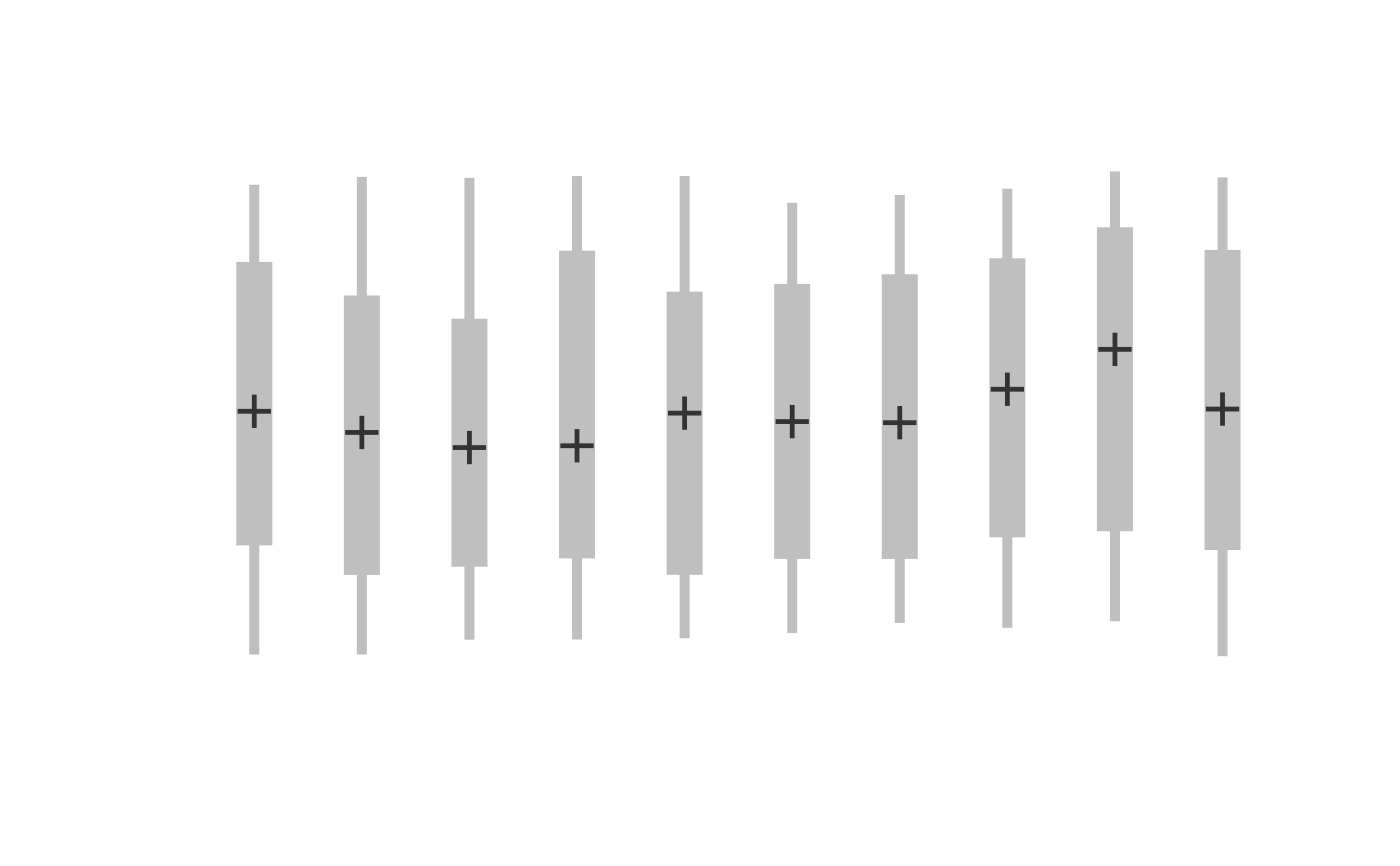
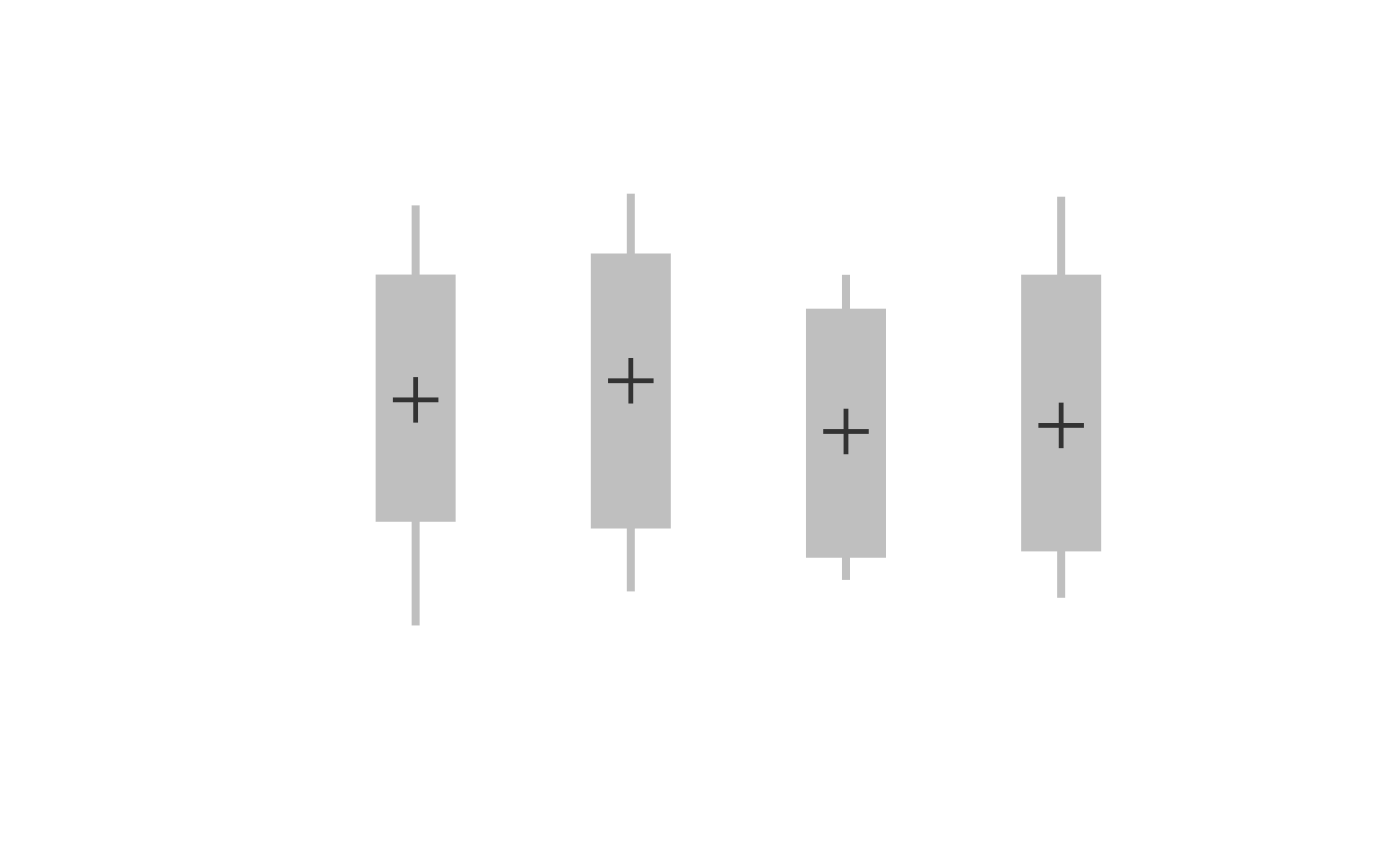
Produce custom box-and-whisker plot(s) of the given (grouped) values.
boxplot2(
  x,
  ...,
  probs = c(0.05, 0.25, 0.5, 0.75, 0.95),
  vc_cex = c(5, 18, 1.4),
  colors = c("grey75", "grey75", "grey20"),
  med_pch = 3,
  add = FALSE,
  at = NULL
)
Arguments
| x | a formula, a an object to be coerced as a data frame. |
|---|---|
| ... | further arguments to be passed to |
| probs | a numeric vector of 5 probabilities used to drawn the boxes.
By default |
| vc_cex | numeric vector of 3 magnifications coefficients. The first one determines the width of the whiskers, the second one is for the width of the box and the last one is for the symbol indicating the median. |
| colors | numeric vector of 3 colors for 1- the whiskers 2- the boxes and 3- the symbols that indicates the median. |
| med_pch |
|
| add | a logical. Should the boxes be added on the current graph? |
| at | numeric vector giving the locations where the boxplots should be drawn, particularly when ‘add = TRUE’; defaults to ‘1:n’ where ‘n’ is the number of boxes. |
Value
Draw a boxplot and returns the coordinates as an invisible output.
Author
Kevin Cazelles

