This function adds a box around a text in an existing plot. It works
differently from the plotrix::textbox() by giving more control to user (no
automatic string cesure).
textBox(
  x,
  y,
  labels,
  align = "c",
  padding = 0,
  cex = 1,
  font = 1,
  col = par("fg"),
  family = par("family"),
  lheight = 1,
  fill = NA,
  border = par("fg"),
  density = NULL,
  angle = 45,
  lwd = par("lwd"),
  lty = par("lty")
)
Arguments
| x | center of the box on the x-axis (see Details). |
|---|---|
| y | center of the box on the y-axis (see Details). |
| labels | string (of length 1) to plot and for which a box is added. |
| align | horizontal alignment of the text inside the box. Possible values: 'center' (or 'c'), 'left' (or 'l'), or 'right' ('r'). |
| padding | amount of space between text limits and box border in the four directions (see Details). |
| cex | size of the text. |
| font | font of the text. |
| col | color of the text. |
| family | font family of the text |
| lheight | line height multiplier used to vertically space multi-line text (see Details). |
| fill | color to fill or shade the rectangle. |
| border | color of the box border. |
| density | density of shading lines (see |
| angle | angle (in degrees) of the shading lines (see |
| lwd | line width for box border (and box shading). |
| lty | line type for box border (and box shading). |
Value
A list of length 4 with:
box, the coordinates of the box (xleft, ybottom, xright, and ytop respectively);
labels, the strings on each line (length of 1 if no
\nis the original string);x, the coordinates on the x-axis of the center of each strings (length of 1 if no
\nis the original string);y, the coordinates on the y-axis of the center of each strings (length of 1 if no
\nis the original string).
With these coordinates, user can draw the box and the text by himself (only
if same parameters are used, e.g. cex, family, lheight, and font).
Details
The xy coordinates correspond to the center of the box. If left and right
paddings are identical (padding[2] == padding[4]) and text is centered
(align = 'c'), then the text is also centered on these coordinates.
padding may be a vector of 1, 2, or 4 values, corresponding to adjustment
of all box borders (1 value), top/bottom and left/right borders (2 values),
or bottom/left/top/right borders (4 values). A positive value adds space
between box border and text, and a negative value removes space between box
border and text.
lheight defines the vertical inter-line spacing in a multi-line string.
If lheight = 1 (default), no inter-line spacing is added (i.e. each line
string is displayed one under the other without space). If lheight = 2, a
vertical space corresponding to one string height is added between lines. If
lheight = 0, all line strings will be overlapping.
Only the three font families ('sans', 'serif' and 'mono') for family are
implemented (no Hershey fonts available).
Other arguments have the same behavior as in the rect() (fill is the
equivalent of col()) and text() functions.
Author
Nicolas CASAJUS, nicolas.casajus@gmail.com
Examples
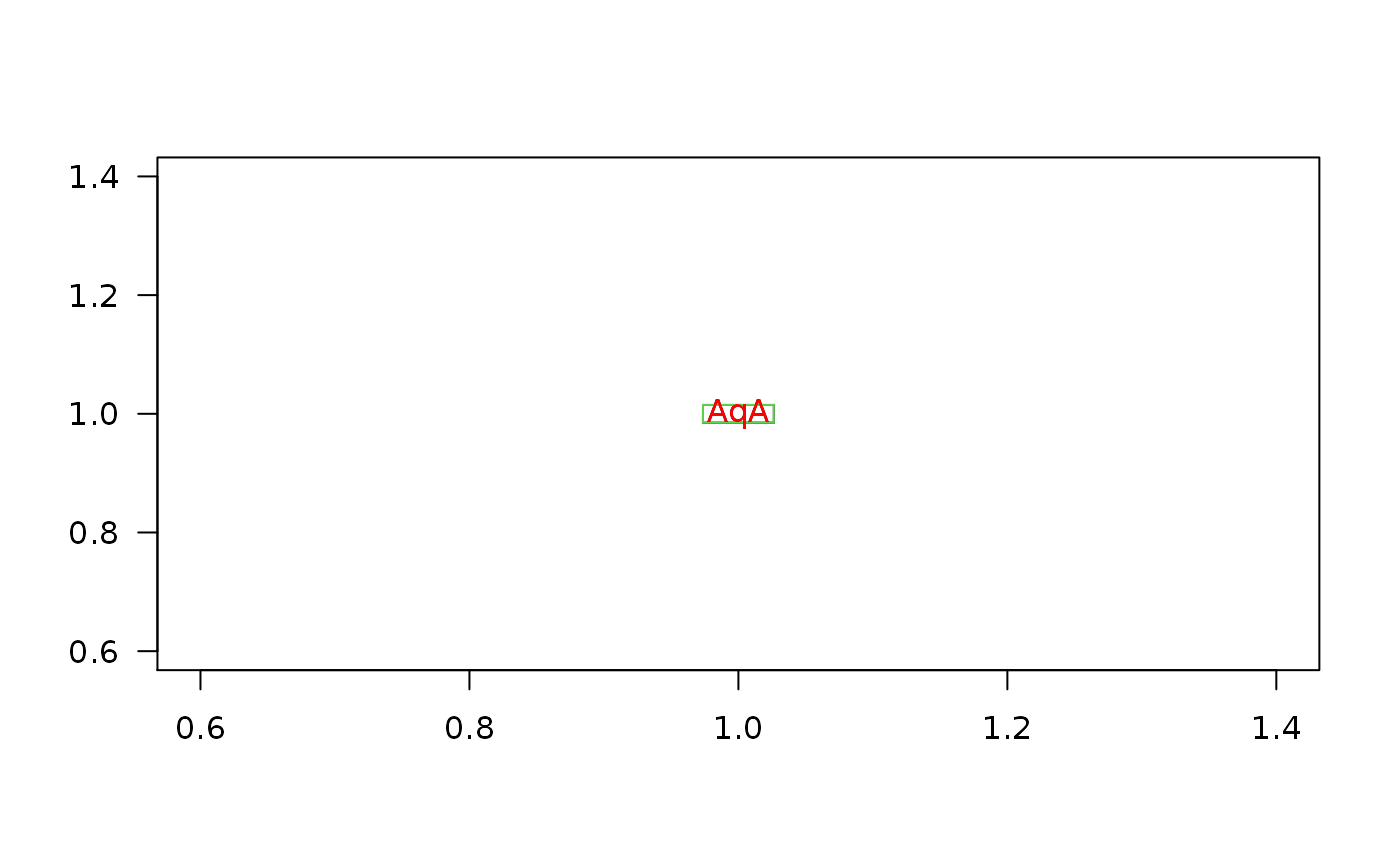
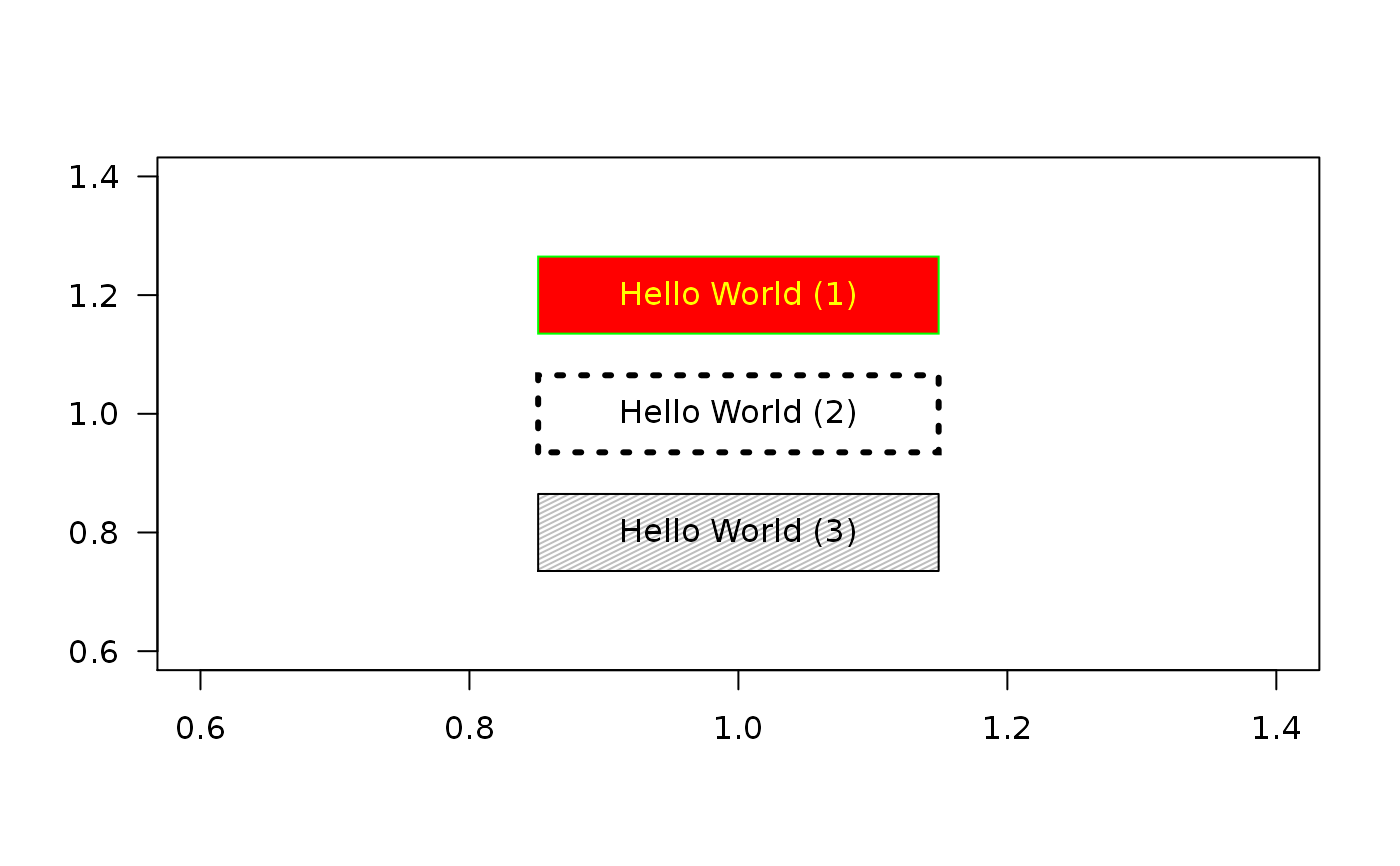
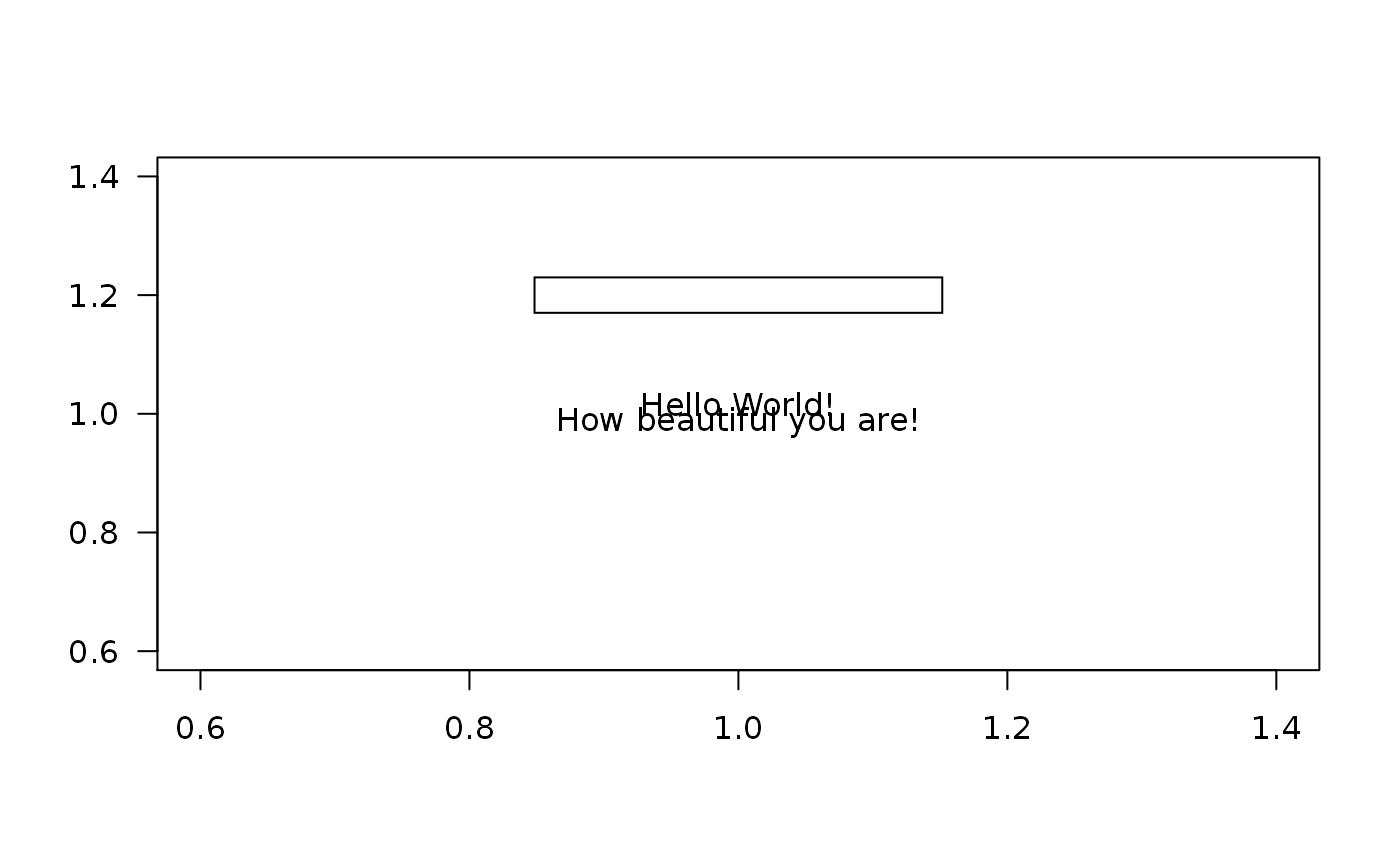
coords <- textBox(x = 1, y = 1, labels = "AqA")#> List of 4 #> $ box : num [1:4] 0.974 0.985 1.026 1.015 #> $ labels: chr "AqA" #> $ x : num 1 #> $ y : num 1textBox(x = 1, y = 1.2, labels = "Hello World (1)", padding = 0.05) # all borderstextBox(x = 1, y = 1.0, labels = "Hello World (2)", padding = c(0.05, 0.20)) # bottom/top and left/righttextBox(x = 1, y = 0.8, labels = "Hello World (3)", padding = c(0.05, 0.05, 0.05, 0.35)) # bottom, left, top, righttextBox(x = 1, y = 1.2, labels = "Hello World (1)", padding = 0.05, col = "yellow", border = "green", fill = "red")## Box Types ---- textBox(x = 1, y = 1.0, labels = "Hello World (2)", padding = 0.05, lwd = 3, lty = 3)textBox(x = 1, y = 0.8, labels = "Hello World (3)", padding = 0.05, density = 30, angle = 45, fill = "gray")textBox(x = 1, y = 1.2, labels = "Hello World (1)", padding = 0.05, family = "mono")textBox(x = 1, y = 1.0, labels = "Hello World (2)", padding = 0.05, family = "serif")textBox(x = 1, y = 0.8, labels = "Hello World (3)", padding = 0.05, family = "serif", font = 3, cex = 3)## Text Alignment ---- texte <- "Hello World!\nHow beautiful you are!" plot(1, type = "n", ann = FALSE, las = 1)textBox(x = 1, y = 1.2, labels = texte, padding = 0.05, align = "l")textBox(x = 1, y = 1.0, labels = texte, padding = 0.05, align = "c")textBox(x = 1, y = 0.8, labels = texte, padding = 0.05, align = "r")textBox(x = 1, y = 1.2, labels = texte, padding = 0.05, align = "l", lheight = 0)textBox(x = 1, y = 1.0, labels = texte, padding = 0.05, align = "l", lheight = 1)textBox(x = 1, y = 0.8, labels = texte, padding = 0.05, align = "l", lheight = 2)textBox(x = 1, y = 1.2, labels = texte, col = "transparent")textBox(x = 1, y = 1.0, labels = texte, lwd = 0)textBox(x = 1, y = 0.8, labels = texte, lwd = 0, col = "transparent")


