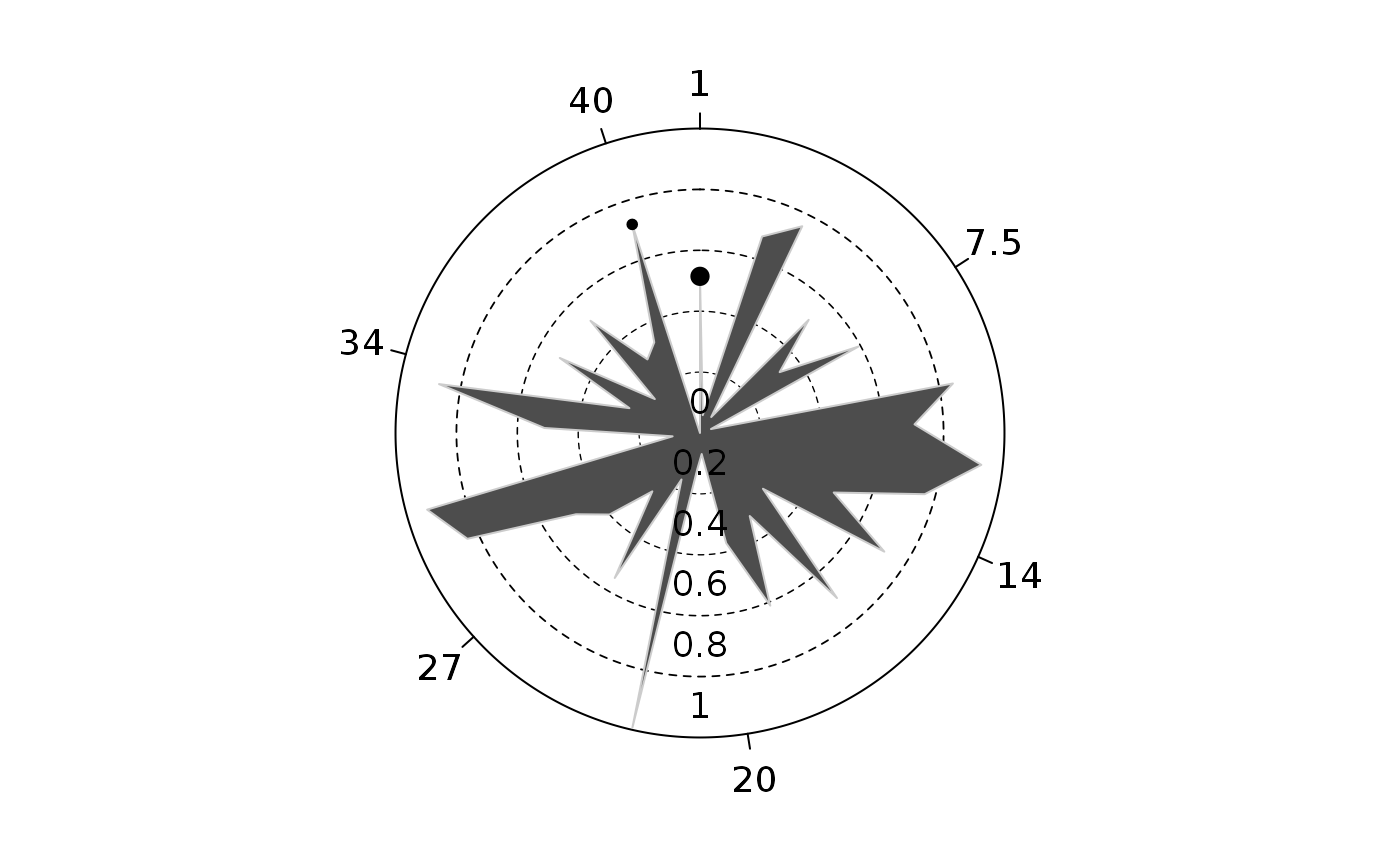
Draws a polar plot.
polarPlot(
  seqtime,
  seqval = NULL,
  rad = 1,
  from = 0,
  to = 2 * pi,
  incr = 0.005,
  labelc = NULL,
  tckcol = 1,
  atc = NULL,
  labelr = NULL,
  atr = NULL,
  clockwise = TRUE,
  n_signif = 2,
  add = FALSE,
  ...
)
Arguments
| seqtime | sequence of time values (equivalent to the x axis). |
|---|---|
| seqval | sequence of values of interest (radial axis, equivalent to the y axis). |
| rad | radius of the circle. |
| from | starting point of the circle. |
| to | ending point of the circle. |
| incr | increment used to draw the circle. |
| labelc | character or expression vector of labels to be placed at the tickpoints. |
| tckcol | color of the tickmarks. |
| atc | the points at which tick-marks are to be drawn. By default (when |
| labelr | character or expression vector specifying the text to be placed at the radial-axis marks. |
| atr | the points at which radial-axis marks are to be drawn. |
| clockwise | logical. If TRUE, the plot must de read clockwise, otherwise, counter-clockwise. |
| n_signif | number of significant numbers to be displayed (used when labelc is |
| add | logical. add to current plot? |
| ... | additional argument to be passed to |
Details
Polar Plot
