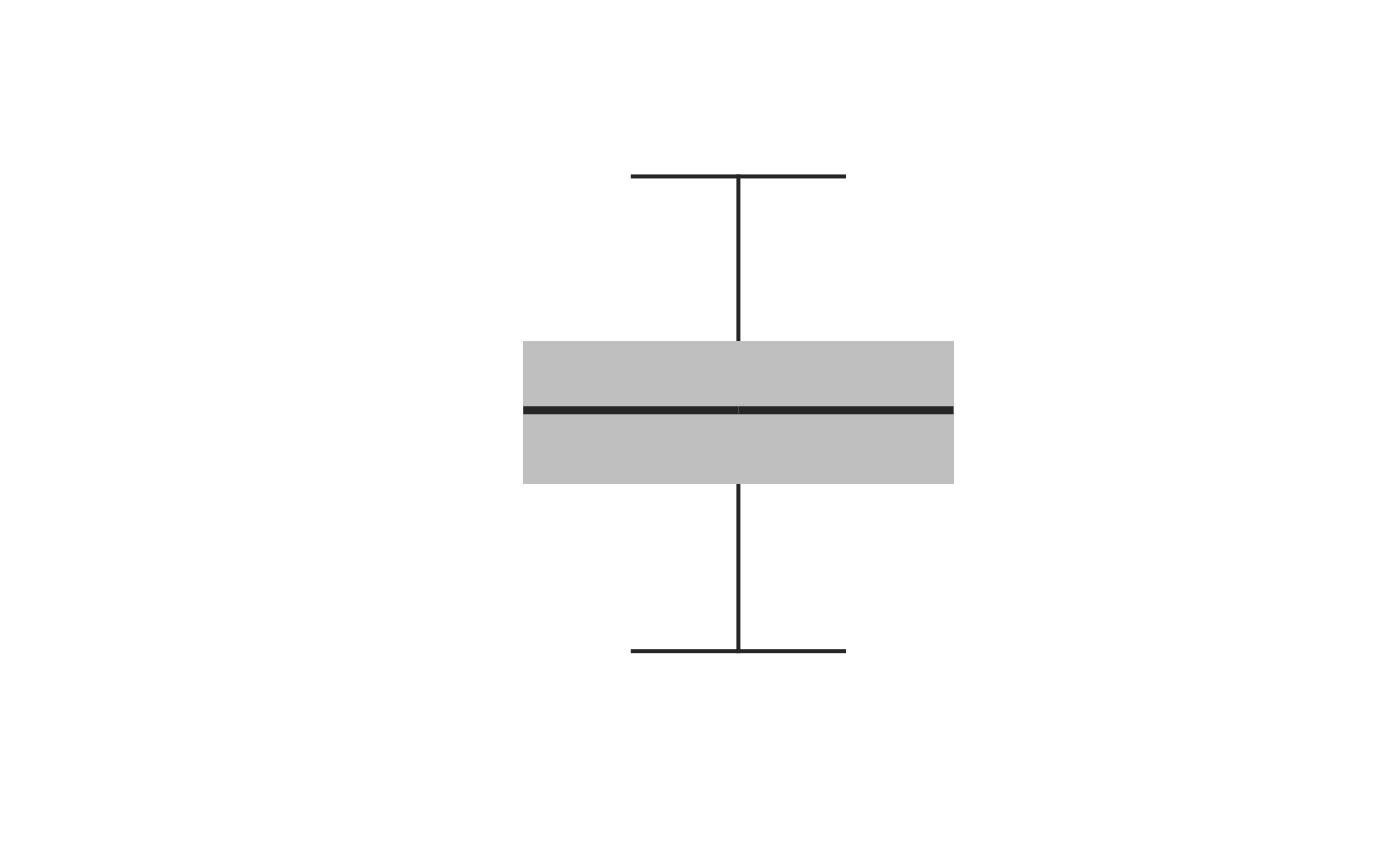
Draws boxplots and bi-boxplots.
biBoxplot(
  df1,
  df2 = df1,
  probs = c(0.01, 0.25, 0.5, 0.75, 0.99),
  width = 0.2,
  sta_wd = 0.5,
  median = NULL,
  staples = NULL,
  whiskers = NULL,
  col_left = "grey75",
  col_right = col_left,
  add = FALSE,
  at = NULL
)
Arguments
| df1, df2 | first and second set of boxplots. |
|---|---|
| probs | numeric vector of five probabilities, see |
| width | a vector giving the relative widths of the boxes making up the plot. |
| sta_wd | staple width. |
| median | a list of arguments passed to |
| staples | a list of arguments passed to |
| whiskers | a list of arguments passed to |
| col_left | color of the left boxes. |
| col_right | color of the right boxes. |
| add | a logical. Should the biboxplots be added on the current graph? If |
| at | numeric vector giving the locations where the boxplots should be drawn. Same default behavior as in |
Details
This functions does not attempt to assess the distributions as it is based on quantiles.
