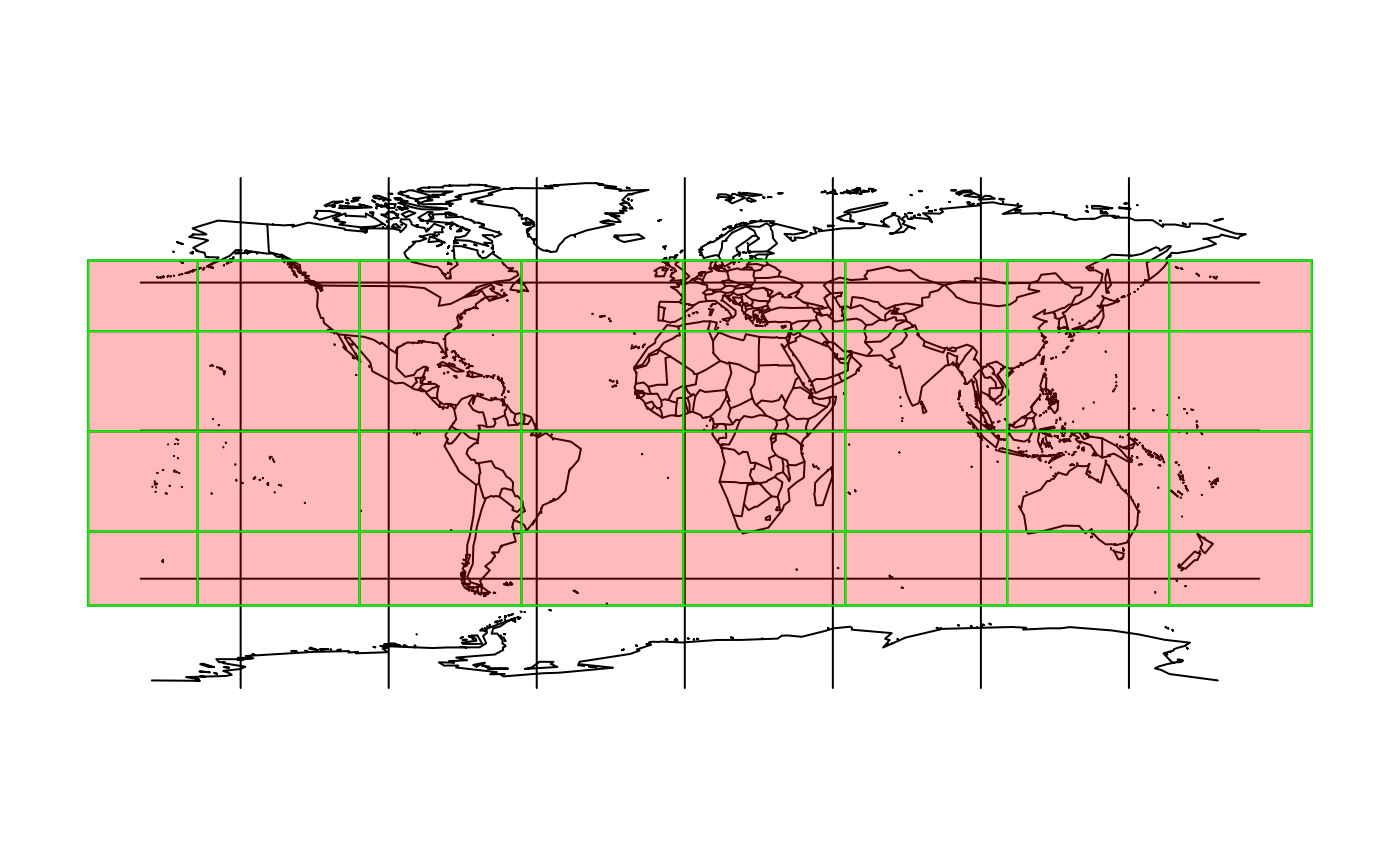
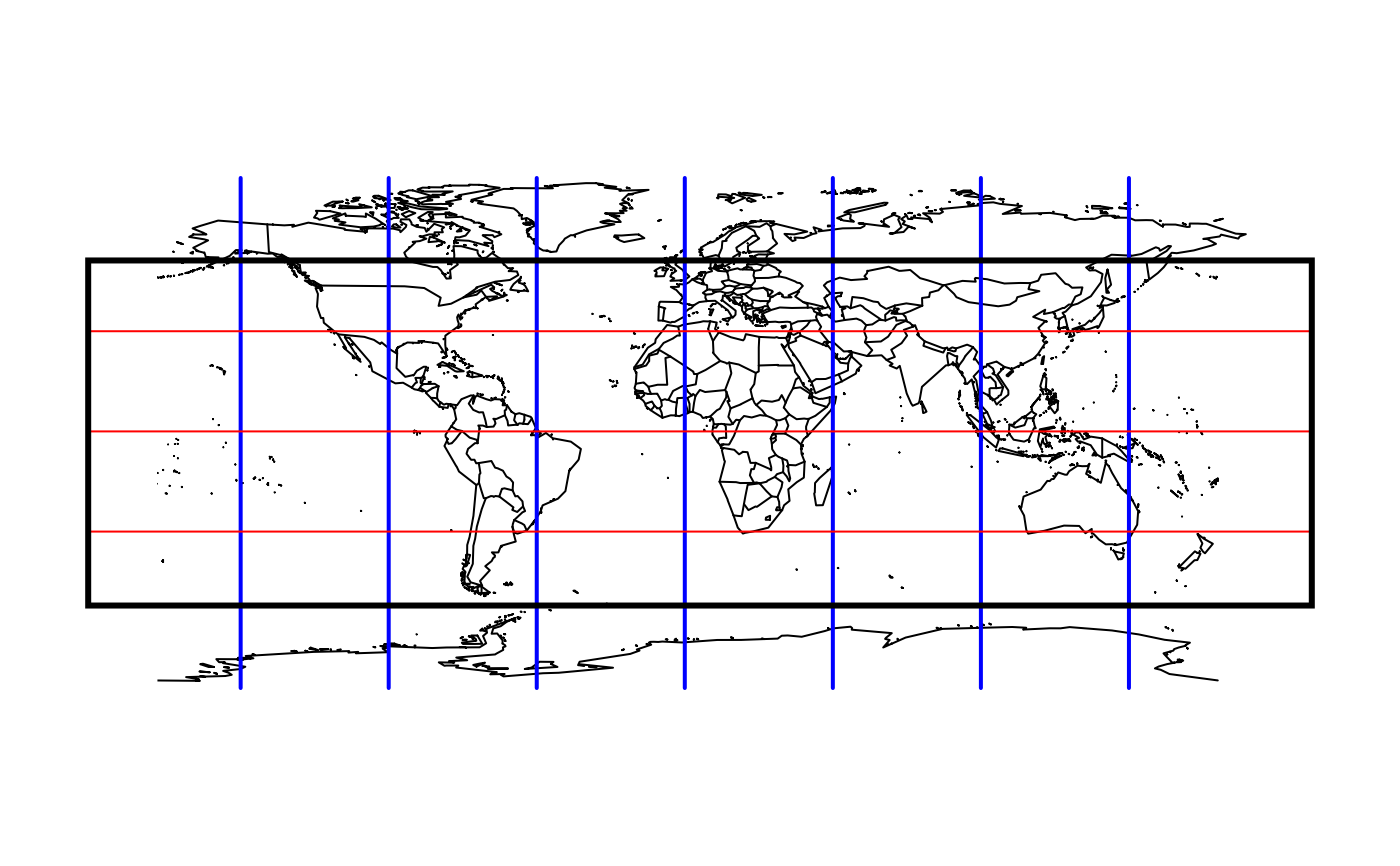
This function adds a grid to an existing plot (like box()). User can
specify coordinates on x- and/or y-axis where to draw vertical and/or
horizontal lines respectively. User can also color the background of the plot
area and add a box around this area (if required).
addGrid(
  at_x,
  at_y,
  col = NA,
  border = "black",
  lwd = 1,
  lty = 1,
  box = FALSE,
  ...
)
Arguments
| at_x | coordinates on the x-Axis where to draw vertical lines. |
|---|---|
| at_y | coordinates on the y-Axis where to draw horizontal lines. |
| col | the color of the background. |
| border | the color of lines (and box). |
| lwd | the width of lines (see |
| lty | the type of lines (see |
| box | a boolean. If |
| ... | other graphical parameters as in |
Details
If user does not specify at_x and at_y, the grid is aligned with the tick
marks on the corresponding default axes (computed by axTicks).
Author
Nicolas CASAJUS, nicolas.casajus@gmail.com
Examples
addGrid()addGrid(box = TRUE)addGrid(col = "#ff000044", border = "green", box = TRUE)addGrid(at_x = NULL, at_y = NULL, lwd = 3, box = TRUE)

